These maps show capital growth or decline over different time periods for all the major cities in the UK. This is especially helpful for property investment, so you can understand what areas have had good or bad capital growth over time. The figures are based on percentiles and are inflation-adjusted.
The data originates from the office of National statistics and is inflation-adjusted to give a true indication of actual real increases or decreases in value between different time points.
For more capital growth data: see Our capital both tables for local authorities in England and Wales
Exeter Plymouth

Exeter Plymouth Inflation-adjusted capital growth 2008 to 2013

Exeter Plymouth inflation-adjusted capital growth 2008 to 2021

Exeter Plymouth inflation-adjusted capital growth 2013 to 2021

Exeter Plymouth inflation-adjusted capital growth 2018 to 21
——————————
Bristol Cardiff

Bristol Cardiff Inflation-adjusted capital growth between 2008 and 2021

Bristol Cardiff Inflation-adjusted capital growth between 2008 and 2013

Bristol Cardiff Inflation-adjusted capital growth between 2013 and 2021

Bristol Cardiff Inflation-adjusted capital growth between 2018 and 2021
——————————
Leeds Bradford York

Leeds Bradford York Inflation-adjusted capital growth between 2008 and 2013

Leeds Bradford York inflation-adjusted capital growth between 2008 and 2021

Leeds Bradford York inflation-adjusted capital growth between 2013 and 2021

Leeds Bradford York inflation-adjusted capital growth 2018 to 2021
——————————
Hull Grimsby Scunthorpe

Hull Grimsby Scunthorpe inflation-adjusted capital growth between 2008 and 2021

Hull Grimsby Scunthorpe inflation-adjusted capital growth between 2018 and 2021

Hull Grimsby Scunthorpe inflation-adjusted capital growth between 2013 and 2021

Hull Grimsby Scunthorpe inflation-adjusted capital growth between 2008 and 2013
——————————
Middlesbrough Hartlepool Darlington Stockton-on-Tees

Middlesbrough Hartlepool Darlington Stockton-on-Tees inflation-adjusted capital growth between 2008 and 2021

Middlesbrough Hartlepool Darlington Stockton-on-Tees inflation-adjusted capital growth between 2018 and 2021

Middlesbrough Hartlepool Darlington Stockton-on-Tees inflation-adjusted capital growth between 2013 and 2021

Middlesbrough Hartlepool Darlington Stockton-on-Tees inflation-adjusted capital growth between 2008 and 2013
——————————
Newcastle Sunderland

Newcastle Sunderland inflation-adjusted capital growth between2008 and 2013

Newcastle Sunderland inflation-adjusted capital growth between 2013 and 2021

Newcastle Sunderland inflation-adjusted capital growth between 2018 and 2021

Newcastle Sunderland inflation-adjusted capital growth between 2008 and 2021
——————————
Blackpool Preston Burnley Blackburn

Blackpool Preston Burnley Blackburn inflation-adjusted capital growth between 2008 and 2013

Blackpool Preston Burnley Blackburn inflation-adjusted capital growth between 2013 and 2021

Blackpool Preston Burnley Blackburn inflation-adjusted capital growth between 2018 and 2021

Blackpool Preston Burnley Blackburn inflation-adjusted capital growth between 2008 and 2021
——————————
Manchester and Liverpool

Inflation-adjusted capital growth greater Manchester and Liverpool between 2008 and 2013

Inflation-adjusted capital growth greater Manchester and Liverpool between 2013 and 2021

Inflation-adjusted capital growth greater Manchester and Liverpool between 2018 and 2021

Inflation-adjusted capital growth greater Manchester and Liverpool between 2008 and 2021
——————————
Sheffield Doncaster Scunthorpe Barnsley

Sheffield Doncaster Scunthorpe Barnsley Inflation-adjusted capital growth between 2008 and 2013

Sheffield Doncaster Scunthorpe Barnsley Inflation-adjusted capital growth between 2013 and 2021

Sheffield Doncaster Scunthorpe Barnsley Inflation-adjusted capital growth between 2018 and 2021

Sheffield Doncaster Scunthorpe Barnsley Inflation-adjusted capital growth between 2008 and 2021
——————————
Birmingham Leicester Coventry

Birmingham Leicester Coventry inflation-adjusted capital growth between 2008 and 2013

Birmingham Leicester Coventry inflation-adjusted capital growth between 2008 and 2021

Birmingham Leicester Coventry inflation-adjusted capital growth between 2013 and 2021
——————————
Nottingham Derby Lincoln Chesterfield Mansfield

Nottingham Derby Lincoln Chesterfield Mansfield inflation-adjusted capital growth between 2008 and 2013

Nottingham Derby Lincoln Chesterfield Mansfield inflation-adjusted capital growth between 2013 and 2021

Nottingham Derby Lincoln Chesterfield Mansfield inflation-adjusted capital growth between 2008 and 2021

Nottingham Derby Lincoln Chesterfield Mansfield inflation-adjusted capital growth between 2018 and 2021
——————————
Peterborough Kettering Corby

Peterborough Kettering Corby inflation-adjusted capital growth between 2008 and 2013

Peterborough Kettering Corby inflation-adjusted capital growth between 2008 and 2021

Peterborough Kettering Corby inflation-adjusted capital growth between 2013 and 2021

Peterborough Kettering Corby inflation-adjusted capital growth between 2018 and 2021
——————————
Northampton Milton Keynes Luton Cambridge

Northampton Milton Keynes Luton Cambridge inflation-adjusted capital growth between 2008 and 2013

Northampton Milton Keynes Luton Cambridge inflation-adjusted capital growth between 2013 and 2021

Northampton Milton Keynes Luton Cambridge inflation-adjusted capital growth between 2008 and 2021
——————————
Birmingham Leicester Coventry
Birmingham Leicester Coventry inflation-adjusted capital growth between 2008 and 2013
Birmingham Leicester Coventry inflation-adjusted capital growth between 2008 and 2021
Birmingham Leicester Coventry inflation-adjusted capital growth between 2013 and 2021
——————————
Nottingham Derby Lincoln Chesterfield Mansfield
Nottingham Derby Lincoln Chesterfield Mansfield Inflation-adjusted capital growth between 2008 and 2013
Nottingham Derby Lincoln Chesterfield Mansfield Inflation-adjusted capital growth between 2013 and 2021
Nottingham Derby Lincoln Chesterfield Mansfield Inflation-adjusted capital growth between 2008 and 2021
Nottingham Derby Lincoln Chesterfield Mansfield Inflation-adjusted capital growth between 2018 and 2021
——————————
Peterborough Kettering Corby
Inflation-adjusted capital growth Peterborough Kettering Corby between 2008 and 2013
Inflation-adjusted capital growth Peterborough Kettering Corby between 2013 and 2021
Inflation-adjusted capital growth Peterborough Kettering Corby between 2018 and 2021
Inflation-adjusted capital growth Peterborough Kettering Corby between 2008 and 2021
——————————
Northampton Milton Keynes Luton Cambridge
Northampton Milton Keynes Luton Cambridge inflation-adjusted capital growth between 2008 and 2013
Northampton Milton Keynes Luton Cambridge inflation-adjusted capital growth between 2013 and 2021
Northampton Milton Keynes Luton Cambridge inflation-adjusted capital growth between 2008 and 2021

Northampton Milton Keynes Luton Cambridge inflation-adjusted capital growth between 2018 and 2021
——————————
Greater London and Northern Home Counties

Greater London and Northern Home Counties inflation-adjusted capital growth between 2008 and 2013
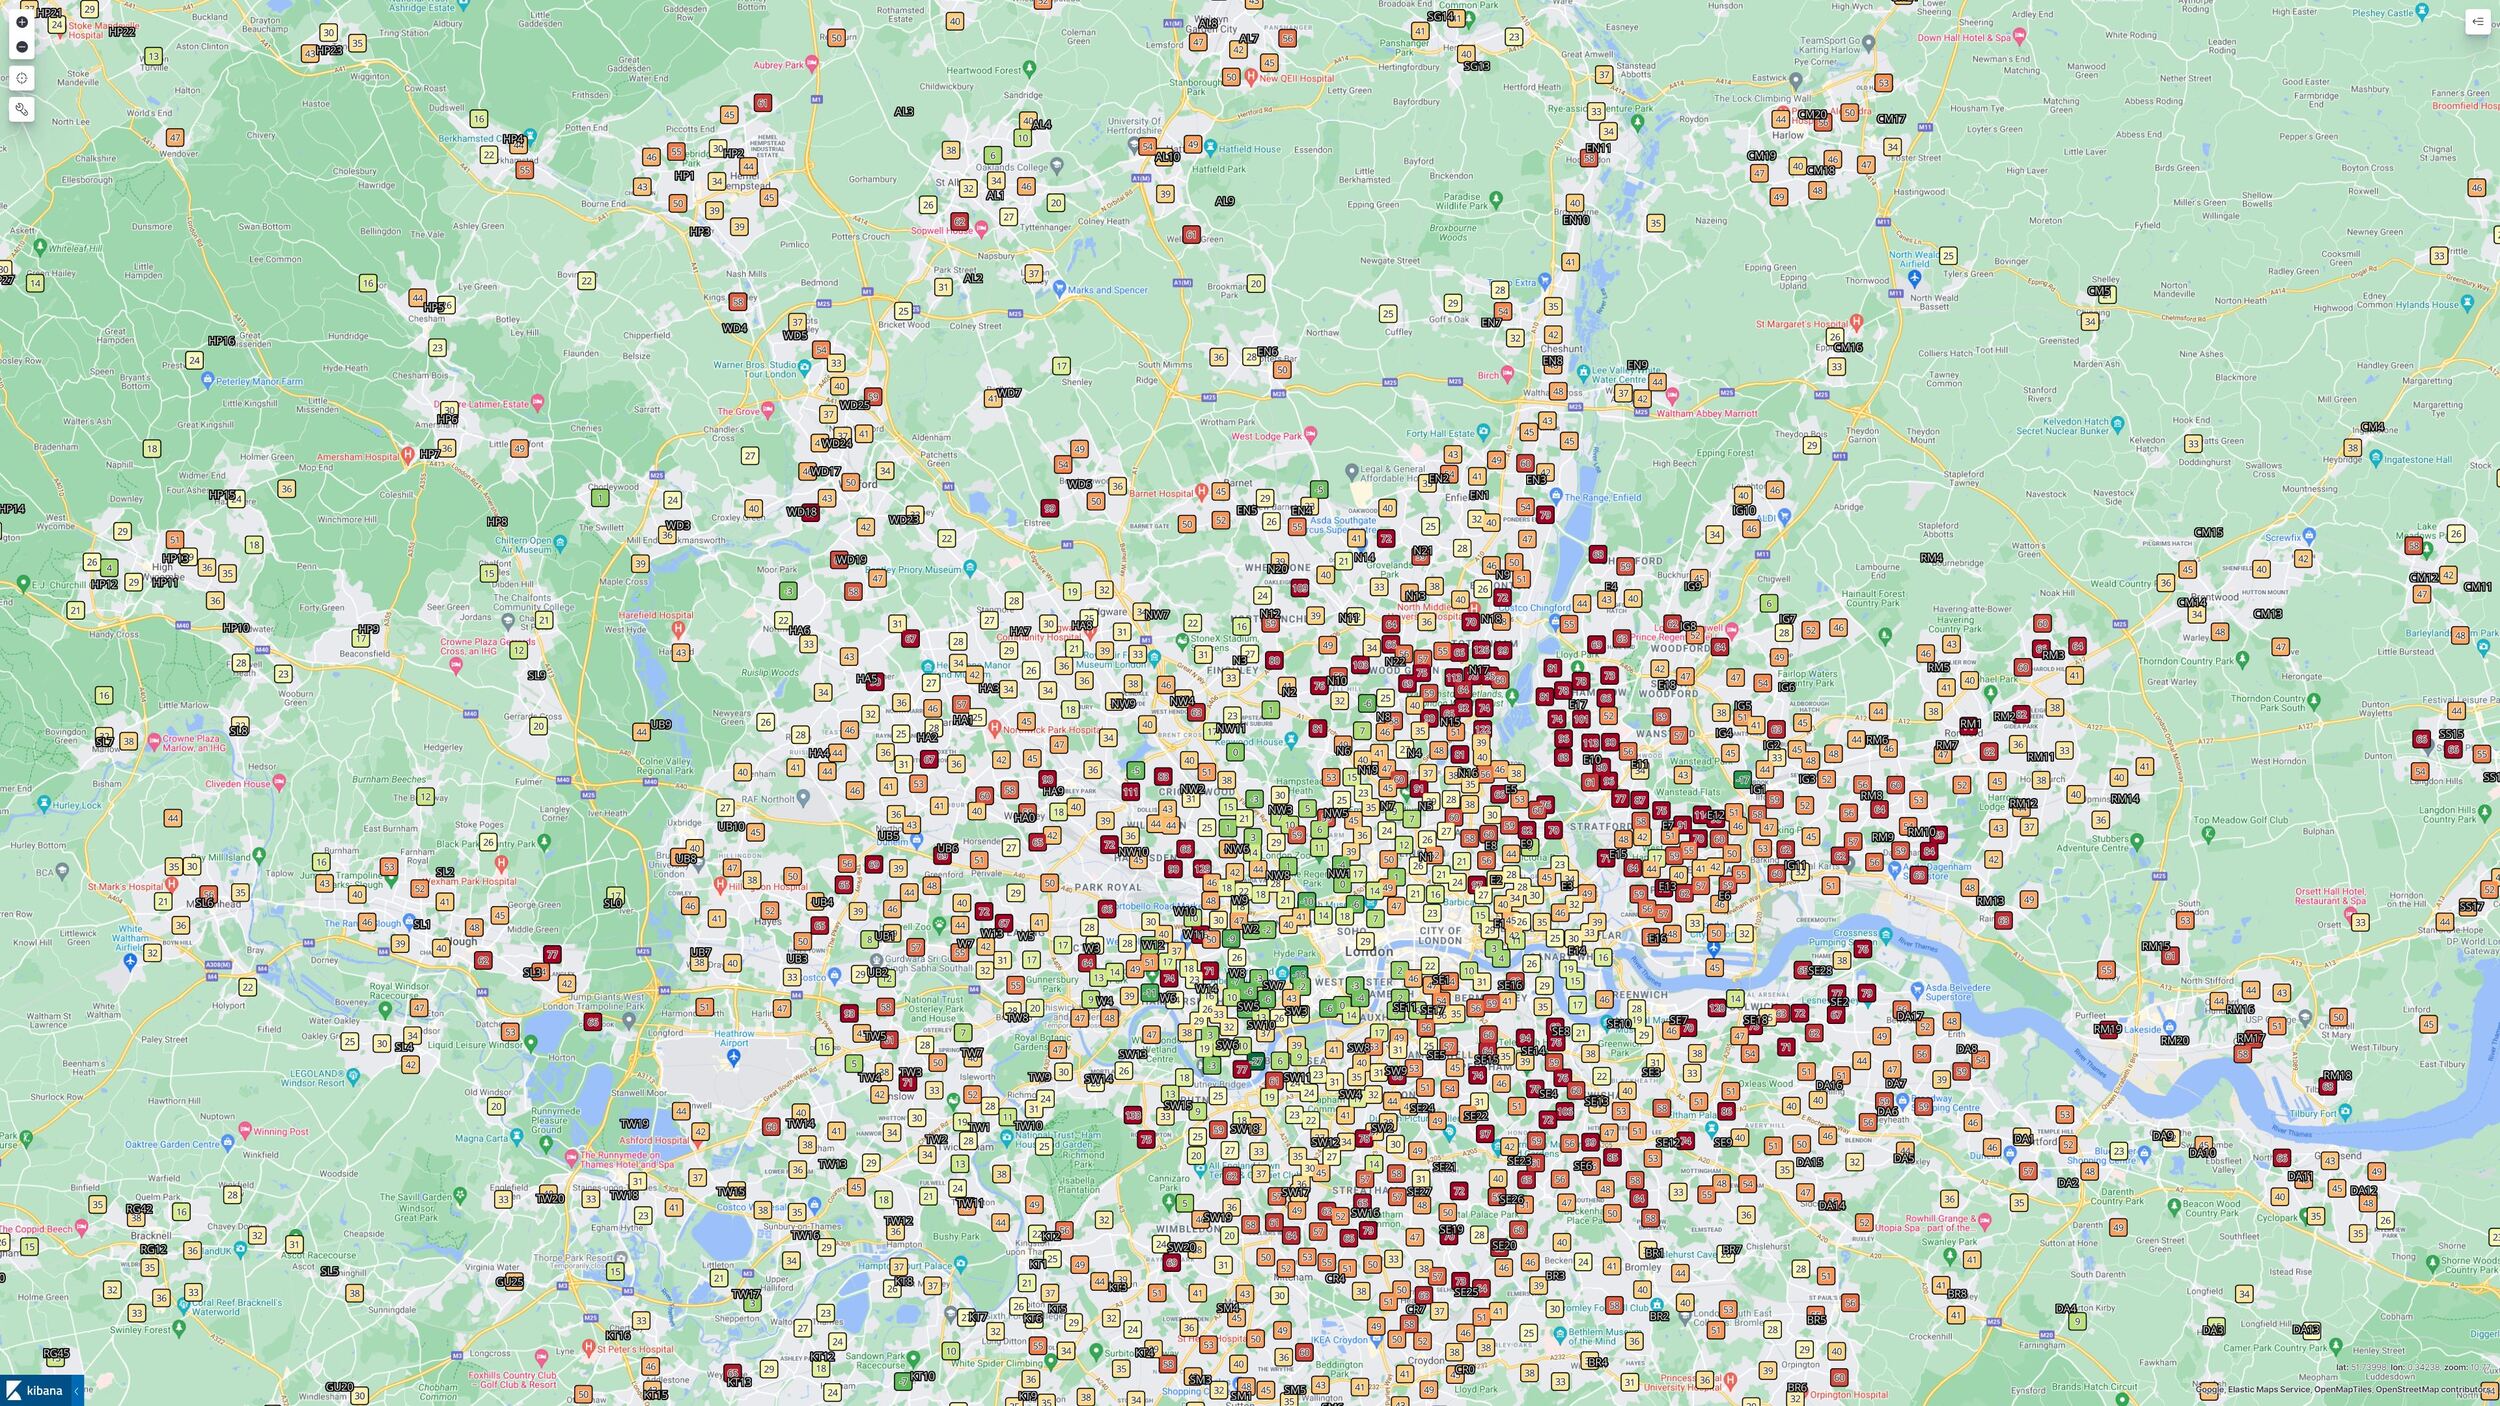
Greater London and Northern Home Counties inflation-adjusted capital growth between 2013 and 2021

Greater London and Northern Home Counties inflation-adjusted capital growth between 2018 to 2021

Greater London and Northern Home Counties inflation-adjusted capital growth between 2008 and 2021
——————————
London and southern Home Counties

London and southern Home Counties inflation-adjusted capital growth between 2013 and 2021

London and southern Home Counties inflation-adjusted capital growth between 2008 and 2013

London and southern Home Counties inflation-adjusted capital growth between 2008 and 2021

London and southern Home Counties inflation-adjusted capital growth between 2018 and 2021
——————————
Portsmouth Brighton

Portsmouth Brighton inflation-adjusted capital growth between 2008 and 2013

Portsmouth Brighton inflation-adjusted capital growth between 2018 and 2021

Portsmouth Brighton inflation-adjusted capital growth between 2013 and 2021

Portsmouth Brighton inflation-adjusted capital growth between 2008 and 2021
——————————
Bournemouth Southampton Isle of Wight

Bournemouth Southampton Isle of Wight inflation-adjusted capital growth between 2008 and 2013

Bournemouth Southampton Isle of Wight inflation-adjusted capital growth between 2013 and 2021

Bournemouth Southampton Isle of Wight inflation-adjusted capital growth between 2008 and 2021
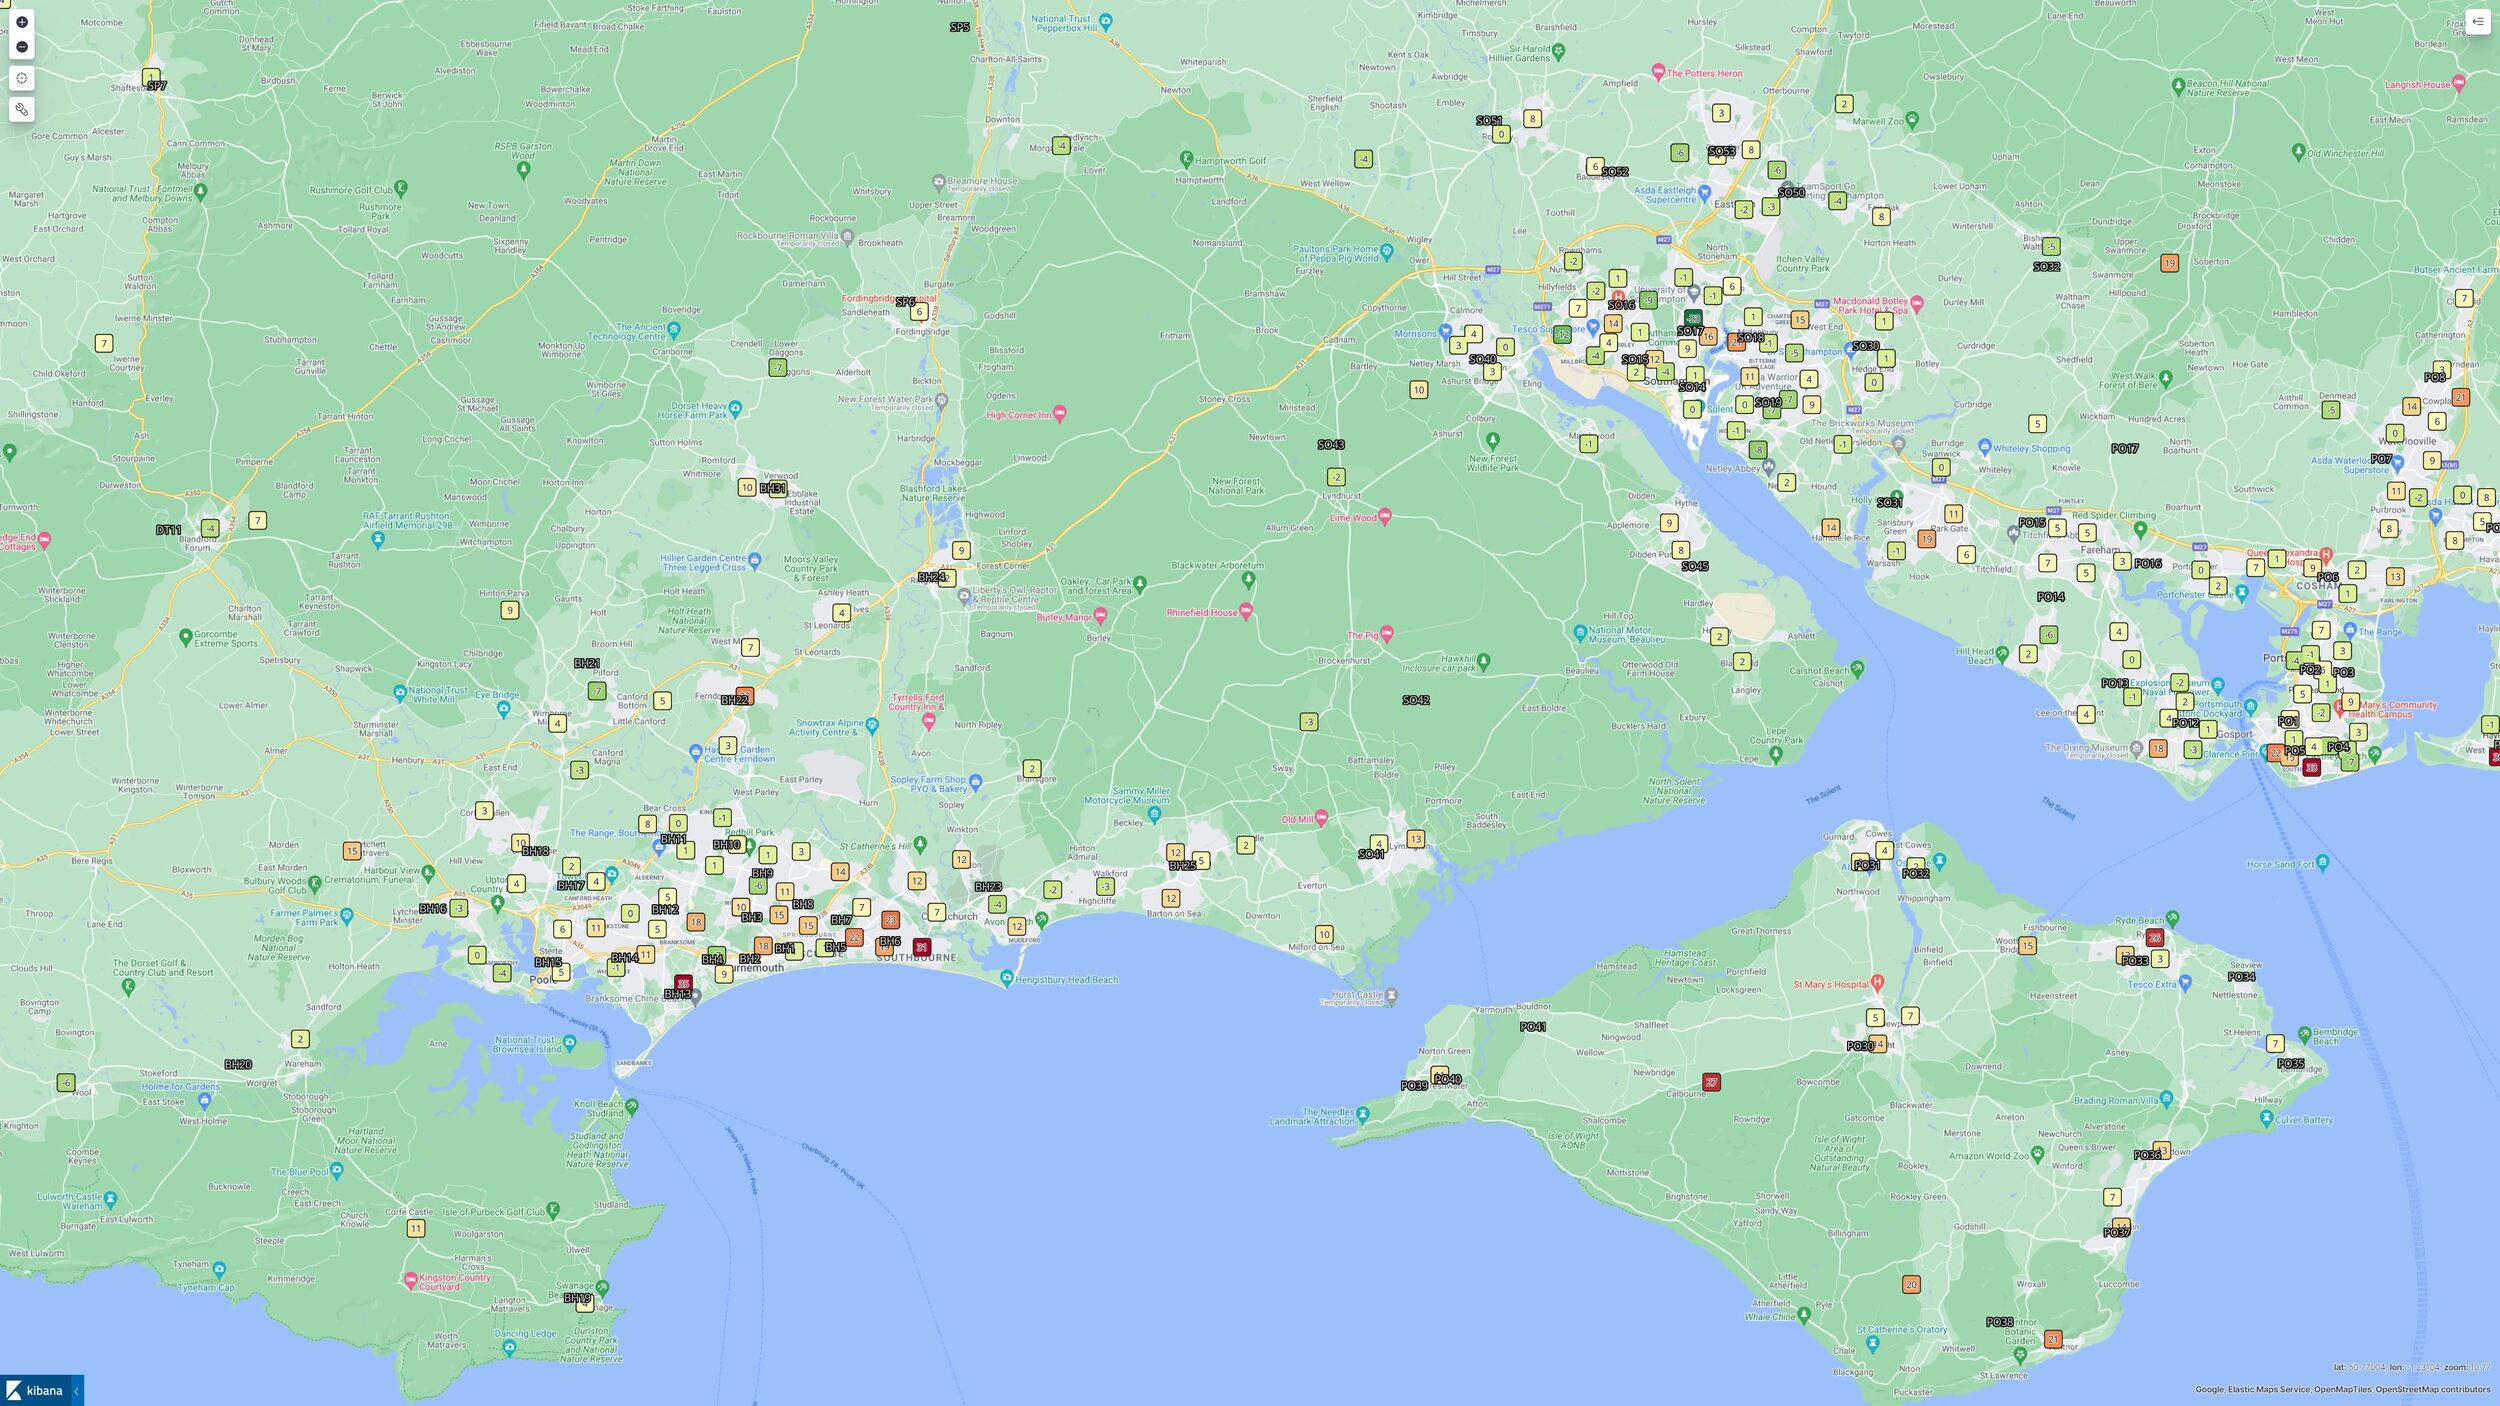
Bournemouth Southampton Isle of Wight inflation-adjusted capital growth between 2018 and 2021
——————————
Exeter and Plymouth

Inflation-adjusted capital growth Exeter and Plymouth between 2008 and 2013

Inflation-adjusted capital growth Exeter and Plymouth between 2013 and 2021

Inflation-adjusted capital growth Exeter and Plymouth between 2018 and 2021

Inflation-adjusted capital growth Exeter and Plymouth between 2008 and 2021
——————————
Bristol and Cardiff

Inflation-adjusted capital growth Bristol and Cardiff between 2008 and 2013

Inflation-adjusted capital growth Bristol and Cardiff between 2013 and 2021

Inflation-adjusted capital growth Bristol and Cardiff between 2018 and 2021

Inflation-adjusted capital growth Bristol and Cardiff between 2008 and 2021
——————————
Leeds Bradford York

Leeds Bradford York inflation-adjusted capital growth between 2008 and 2013

Leeds Bradford York inflation-adjusted capital growth between 2013 and 2021

Leeds Bradford York inflation-adjusted capital growth between 2008 and 2021

Leeds Bradford York inflation-adjusted capital growth between 2018 and 2021
——————————
Hull Grimsby Scunthorpe

Hull Grimsby Scunthorpe inflation-adjusted capital growth between 2008 and 2013

Hull Grimsby Scunthorpe inflation-adjusted capital growth between 2008 and 2021

Hull Grimsby Scunthorpe inflation-adjusted capital growth between 2013 and 2021

Hull Grimsby Scunthorpe inflation-adjusted capital growth between 2018 and 2021
——————————
Middlesbrough Hartlepool Darlington Stockton

Middlesbrough Hartlepool Darlington Stockton inflation-adjusted capital growth between 2008 and 2013

Middlesbrough Hartlepool Darlington Stockton inflation-adjusted capital growth between 2013 and 2021

Middlesbrough Hartlepool Darlington Stockton inflation-adjusted capital growth between 2008 and 2021

Middlesbrough Hartlepool Darlington Stockton inflation-adjusted capital growth between 2018 and 2021
——————————
Newcastle Sunderland

Newcastle Sunderland inflation-adjusted capital growth between 2008 and 2013

Newcastle Sunderland inflation-adjusted capital growth between 2013 and 2021

Newcastle Sunderland inflation-adjusted capital growth between 2008 and 2021

Newcastle Sunderland inflation-adjusted capital growth between 2018 and 2021